Portfolio overviewTotals for the whole portfolio, then every property ranked with its own sparkline and period-over-period delta.Read moreRealtimeA live event feed, active pages and countries, and the visitors who have been on site longest, streamed rather than polled by hand.Read morePerson profilesEvery event, every device, every referrer and every product, on one page per person, resolved across the portfolio.Read moreFunnelsAny sequence of events or pages, with per-step loss and a list of the people who abandoned.Read moreUser journeysA Sankey of page-to-page flow, entry and exit pages ranked by rate, and the pages producing frustration.Read moreRetentionCohort grids by day, week or month, and a stickiness distribution of how often people return within a period.Read moreEventsAn explorer over every event name, its trend, the pages it fires on and the sessions containing it.Read moreGoals & revenueGoals from events or paths, conversion rates, and revenue attributed three different ways.Read moreAI & crawlersEvery AI agent that fetched your pages, split by whether it was answering a question or building a corpus, plus the readers they sent back.Read moreAlertsThreshold, anomaly, no-data and error-spike rules delivered to Slack, email or a webhook, with history.Read moreMCP server25 verified MCP tools over stdio or HTTP, with tenant isolation, scope enforcement and no destructive actions.Read moreCross-project insightsA metric × dimension × chart builder across all properties, plus the people who used more than one of them.Read moreTracker & SDKs2.9 KB gzipped, zero dependencies, SPA-aware, with Node and React SDKs and a hard size gate in CI.Read moreTeams & sharingOwner, admin, member and viewer roles re-derived on every mutation, plus invitations and public read-only links.Read morePrivacy & GDPRNo raw IPs, cookieless mode, consent enforced at the server, and export and erasure that actually run.Read more
In context
What the dashboard actually looks like
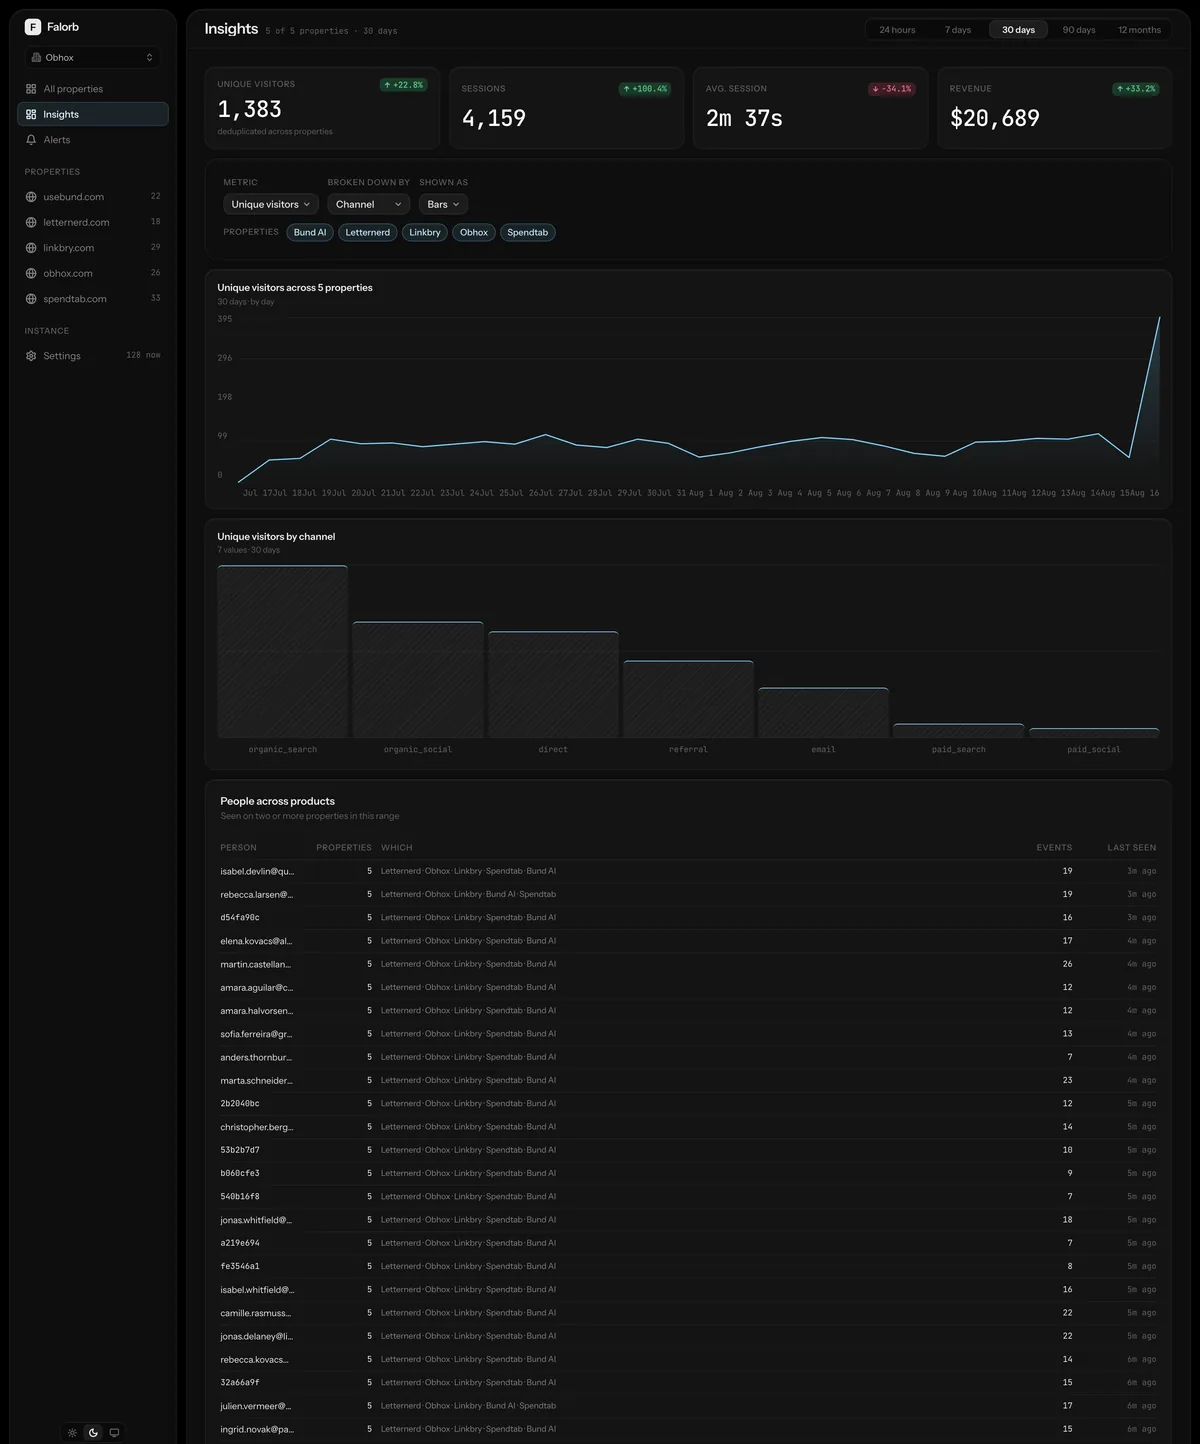
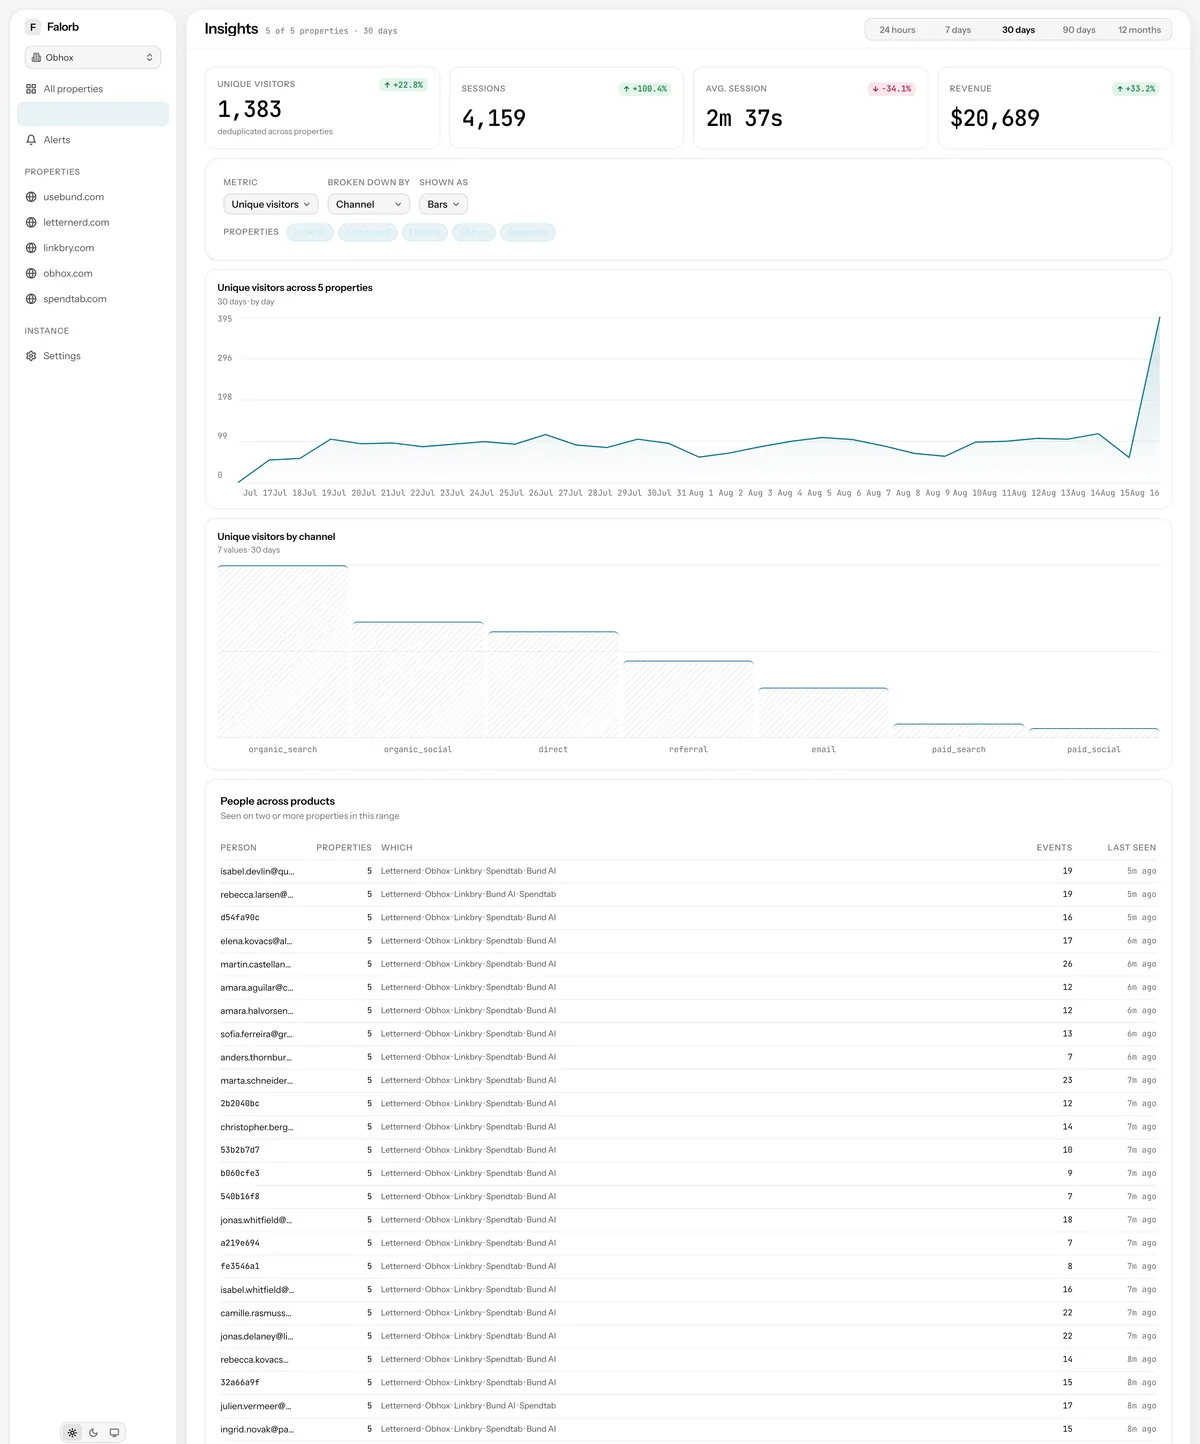
Every screenshot on this site is the real interface running against a seeded demo workspace. No mockups, no illustrated approximations of a chart.
It is one Docker Compose file away
Bring up Postgres, Redis and ClickHouse, run the migrations, and paste one script tag into your site.