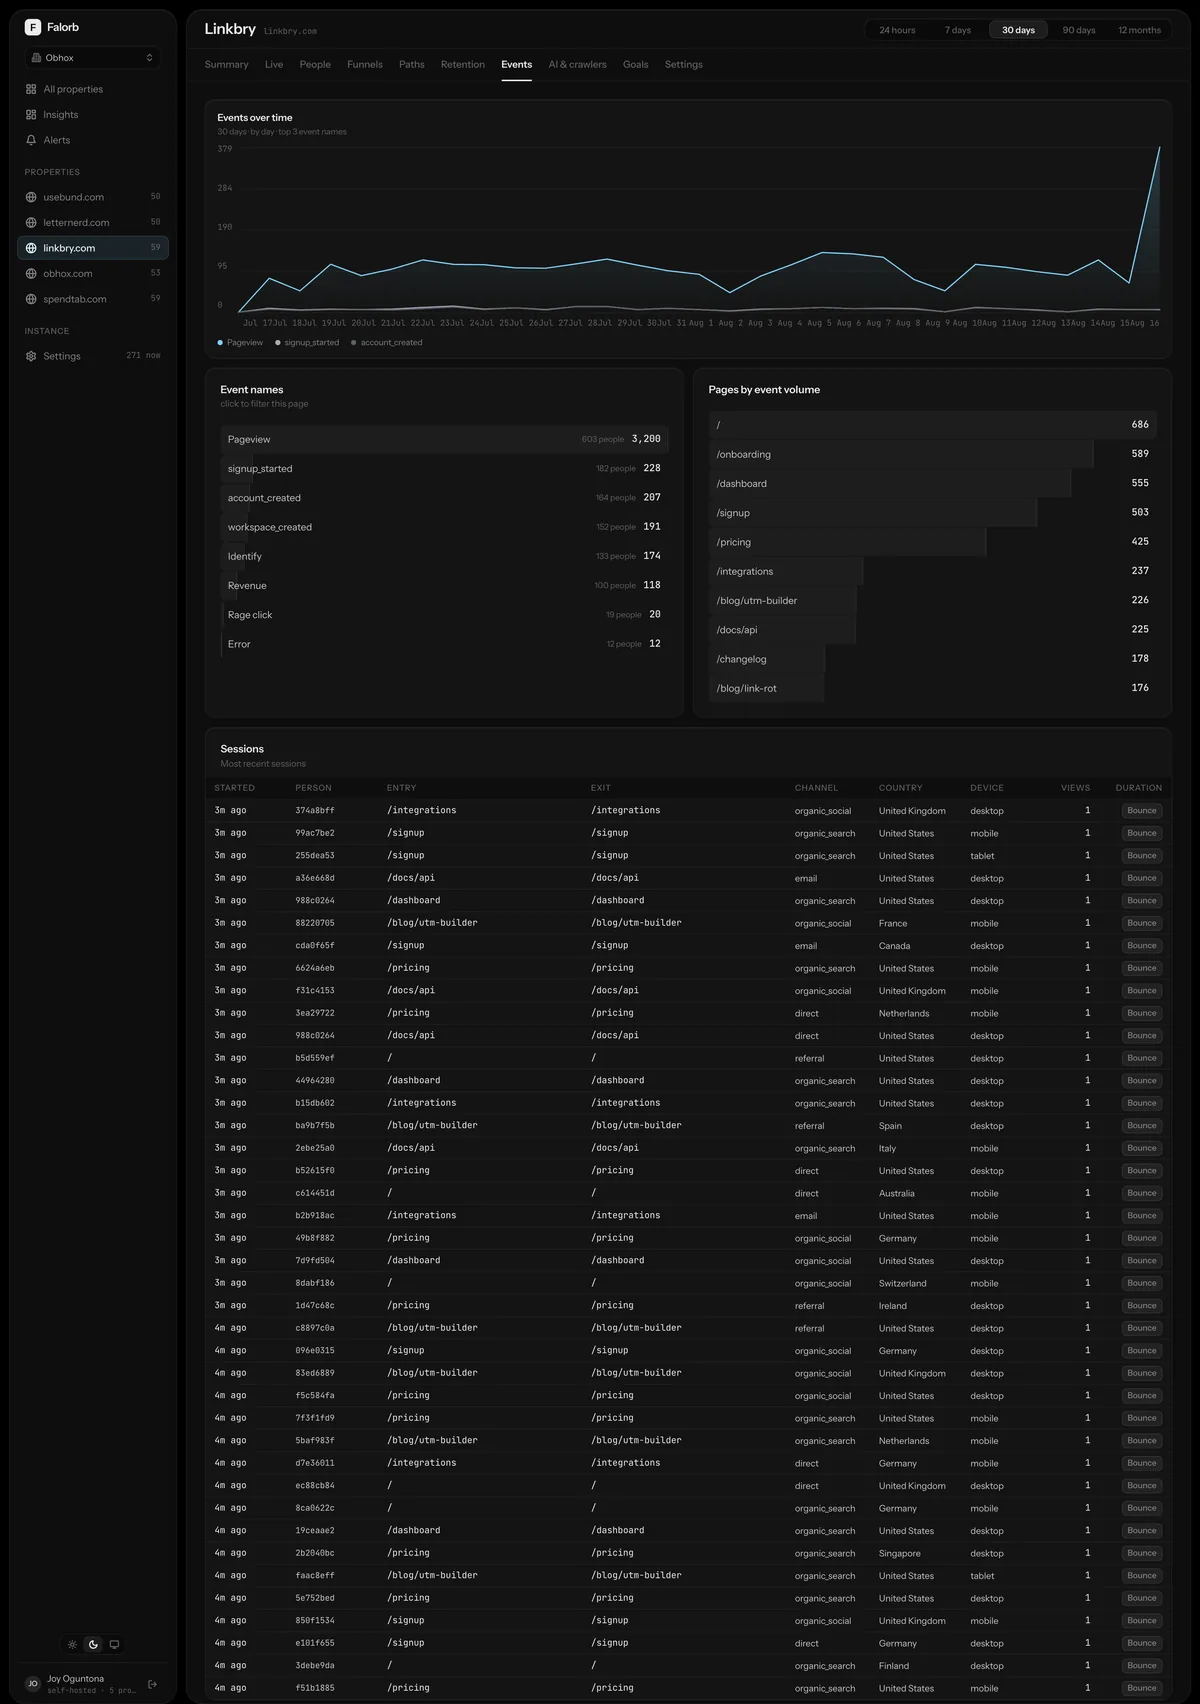
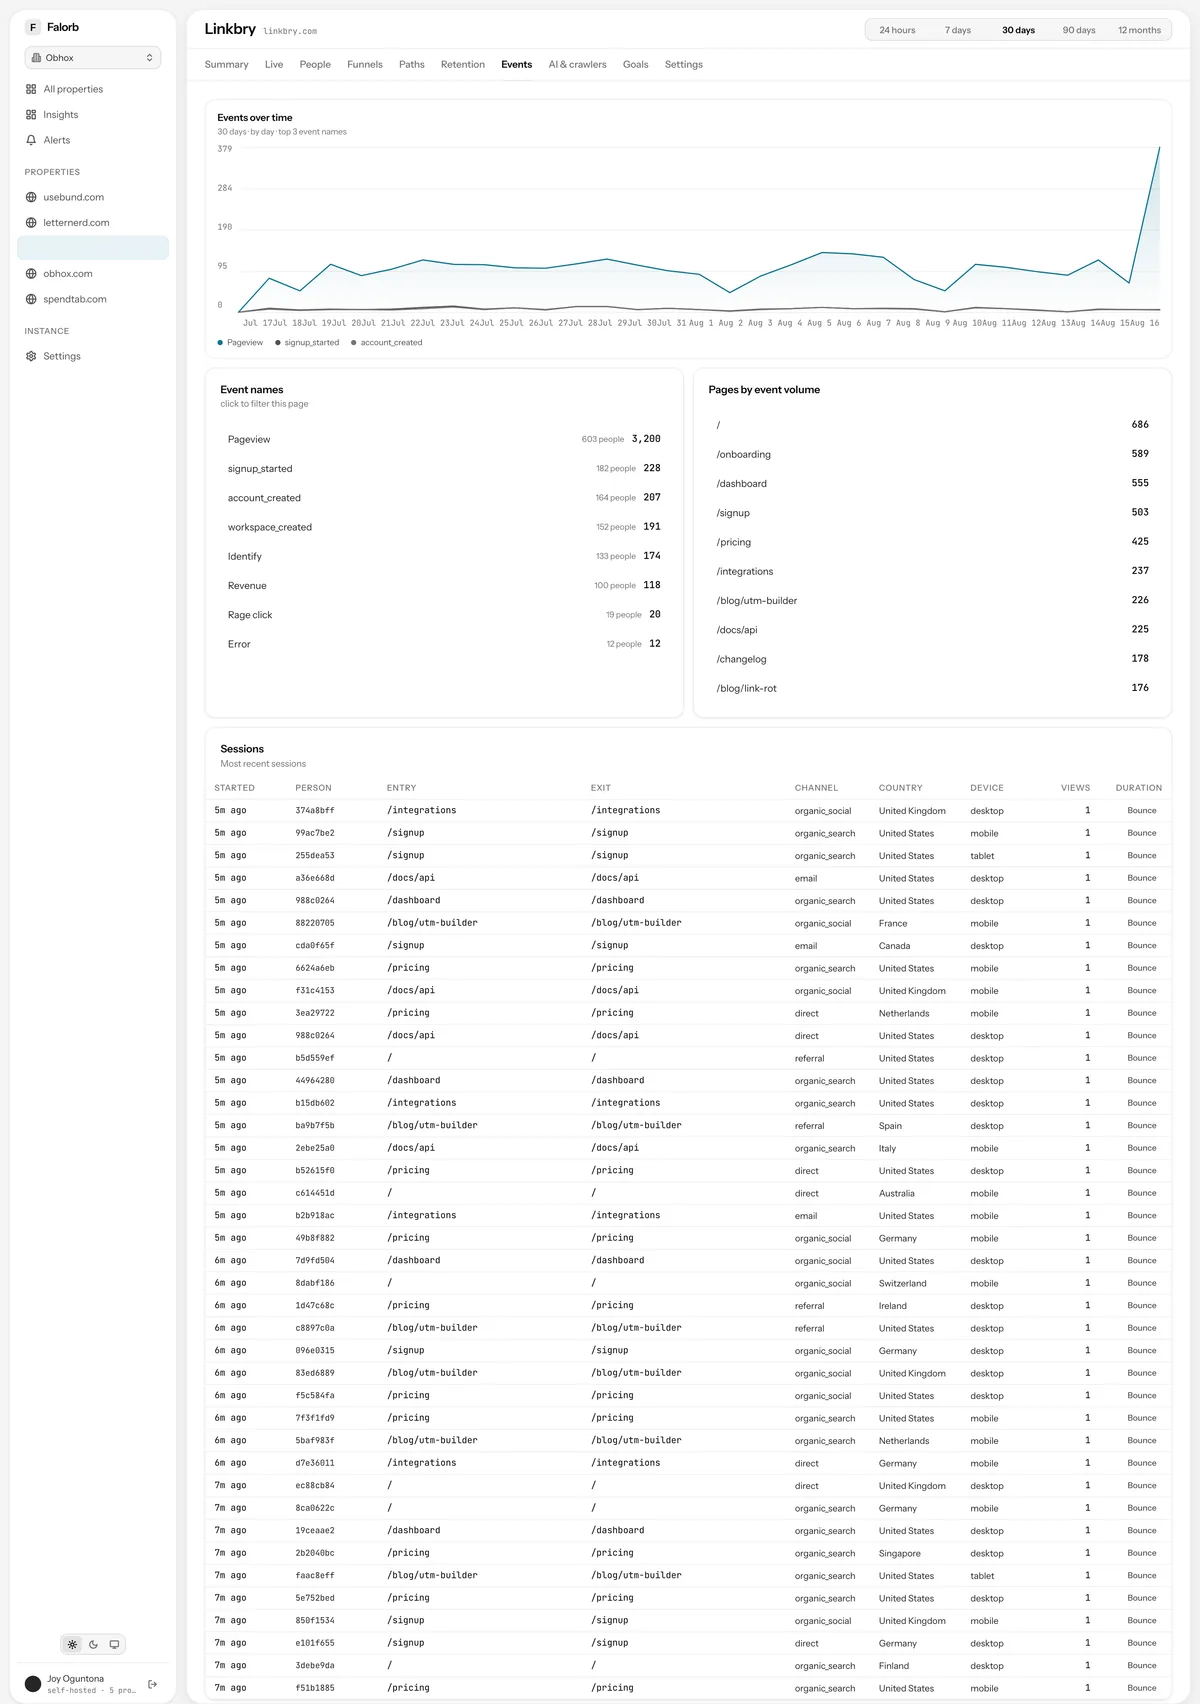
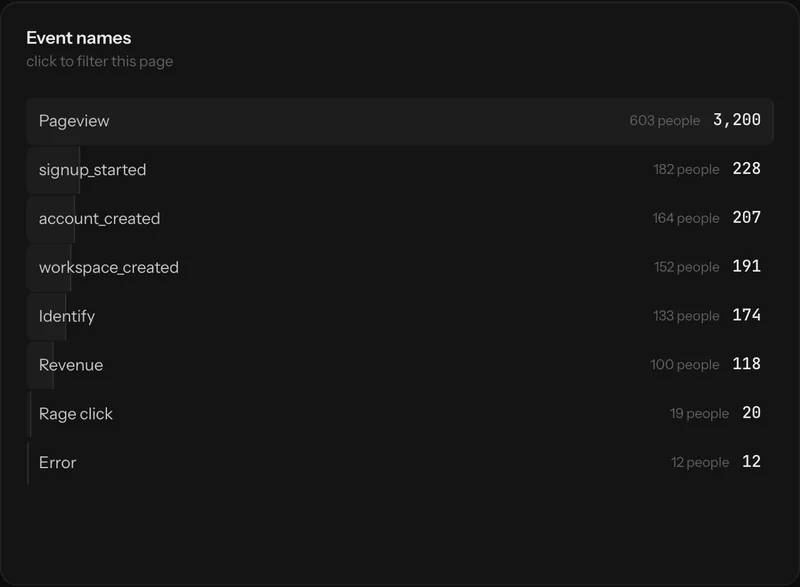
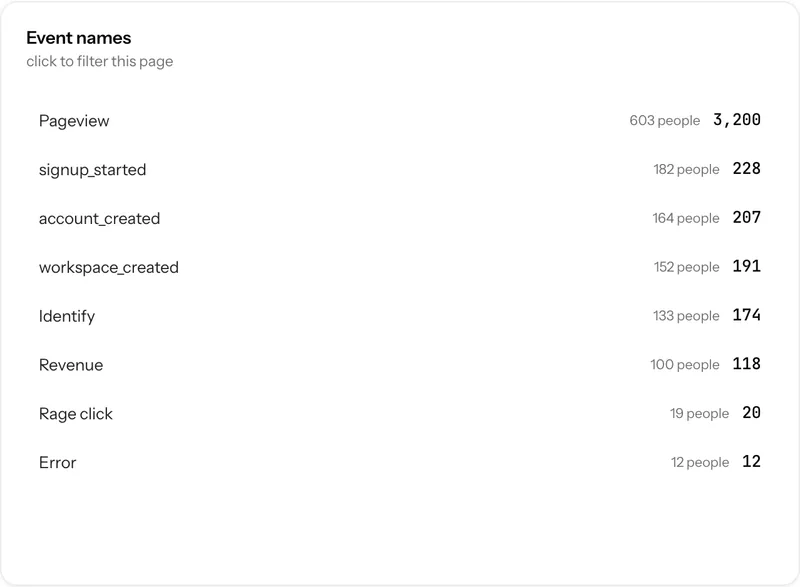
Every name the property has sent
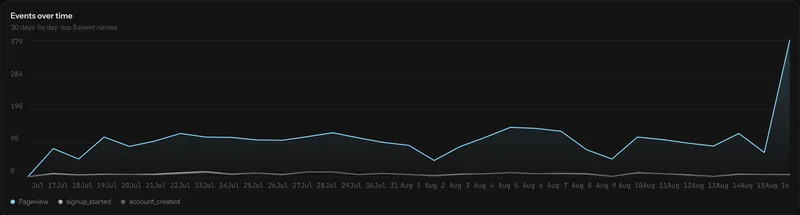
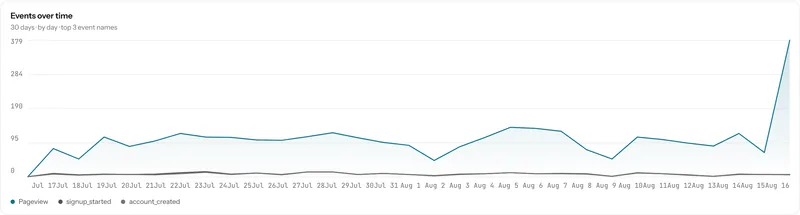
Including the ones nobody remembers adding. Volume per name over the range, so a tracking call that broke in a deploy three weeks ago is visible as a line that stops.
Trend, filtered to what you selected
Interval chosen to fit the range, with the previous period available for comparison. Six metrics are available on the trend and any dimension can be used as a breakdown series.
Where it fires
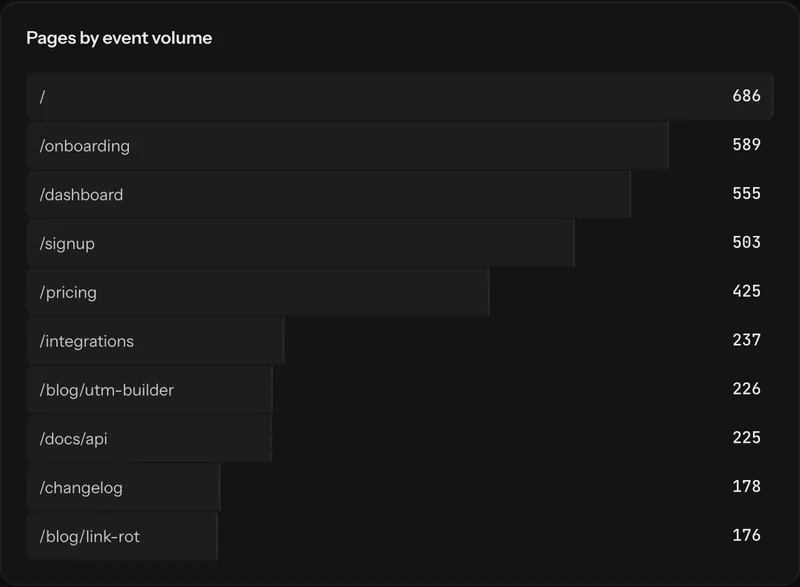
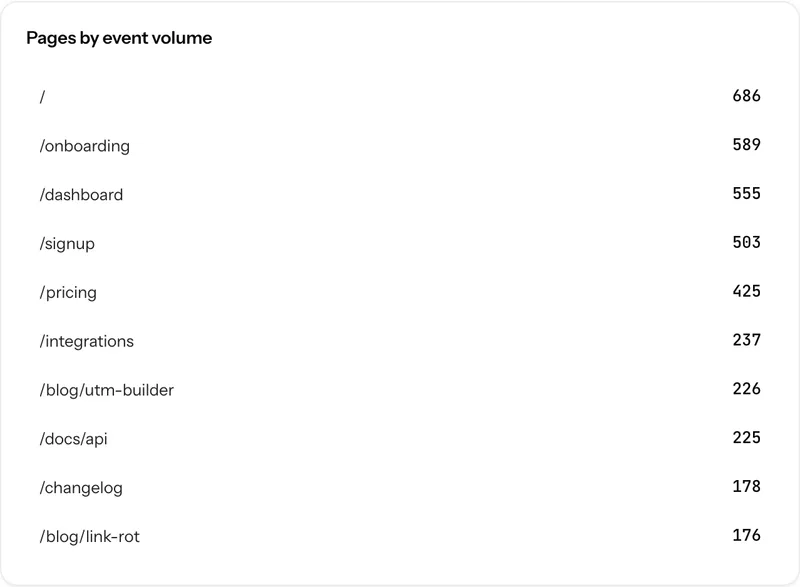
The pages producing an event, which is the fastest way to find out that your signup CTA fires from a page you forgot existed, or that it does not fire from the page you built it for.
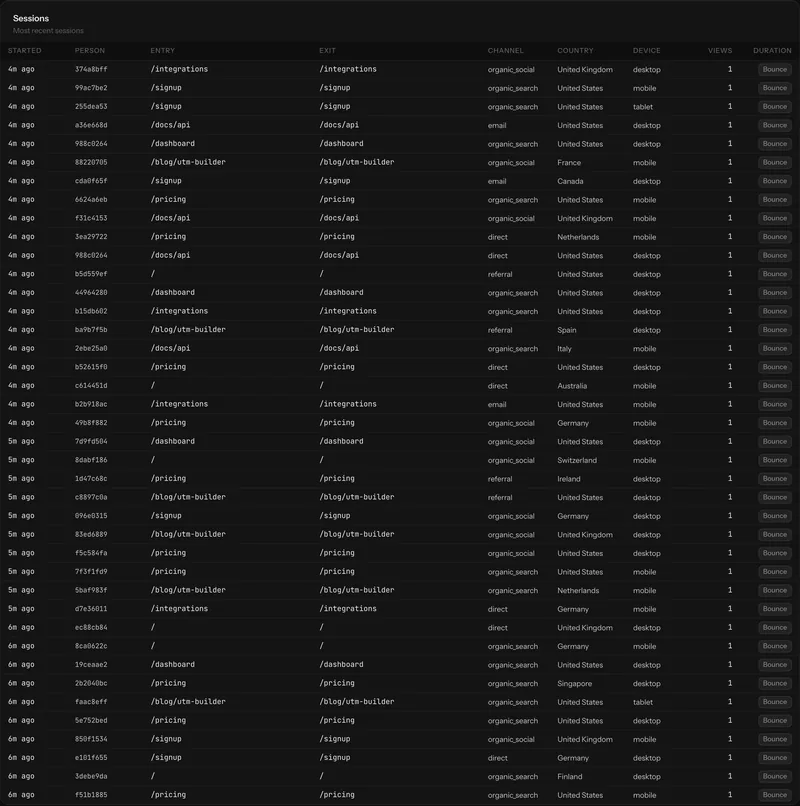
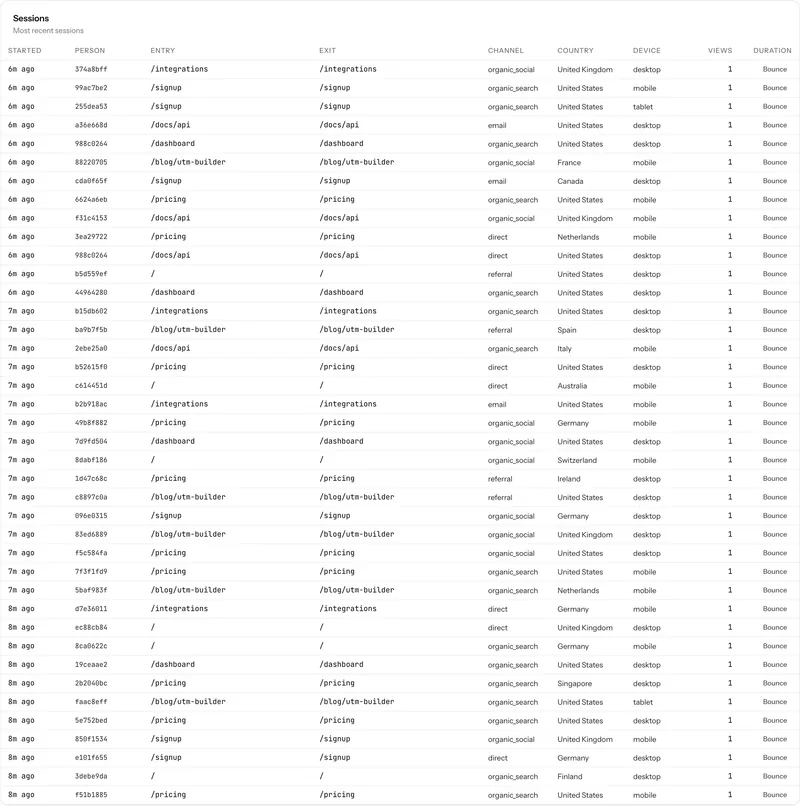
Sessions, then people
The sessions an event occurred in, each expandable to its full event list, each linked to the person who had it. From an anomaly in a chart to the actual sequence of actions that produced it is two clicks.
How it works, precisely
- Collected automatically
- Pageviews, outbound clicks, downloads, form submits, scroll depth, rage and dead clicks, JS errors, Core Web Vitals
- Manual API
- track, page, identify, group, revenue, reset, consent
- Custom properties
- Any JSON-safe value; usable as a filter and as a breakdown dimension
- Never collected
- Form field values. Form identity only
Events: the usual questions
Do I have to declare events in advance?
No. Send a name and it appears. The explorer lists whatever has arrived, and property keys are discovered the same way.
What stops a typo becoming a permanent second event name?
Nothing automatic. The explorer just shows you both, usually within a minute of the first one arriving. That visibility is the point of listing every name rather than a curated set.
Next, most people read
Run it yourself this afternoon
Clone the repository, bring up the stack with Docker Compose, paste one script tag. The data never leaves your machines.