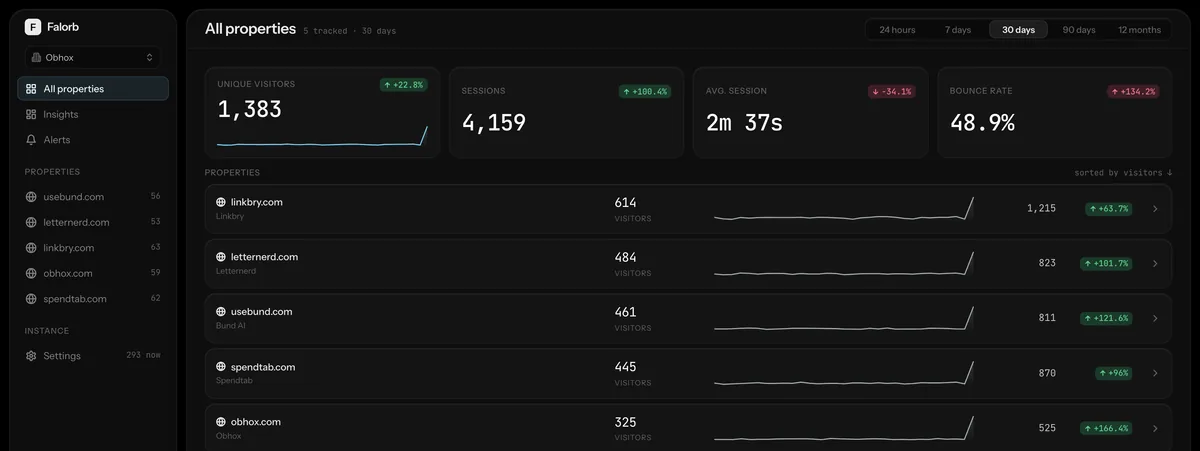
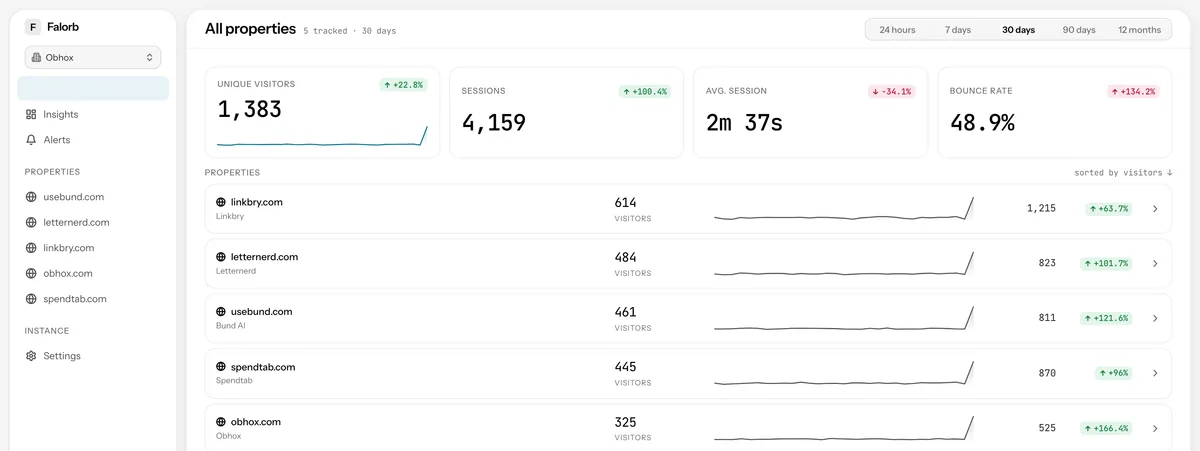
The four figures that frame everything else
Unique visitors, sessions, average session length and bounce rate for every property at once, each against the same window in the previous period. Bounce rate and session duration are computed session-side rather than averaged over pageviews, so a single long session cannot flatter a whole day.


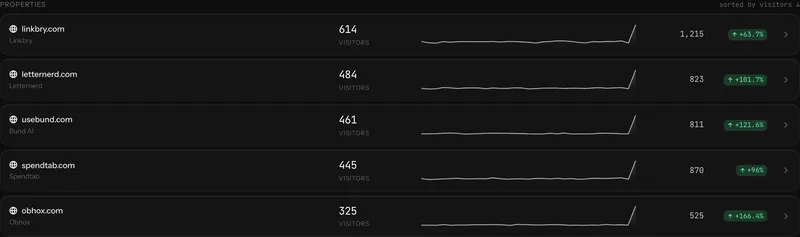
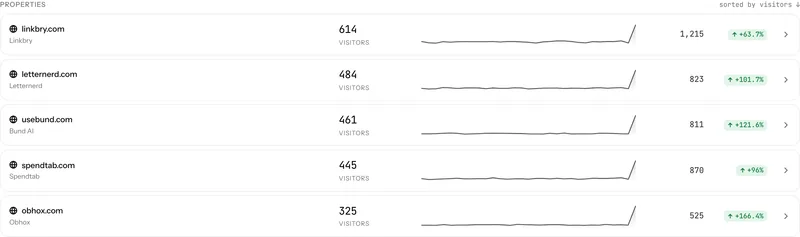
Every property, ranked, with the shape of its month
Each row carries visitors, a sparkline over the selected range, total events and the change against the previous period. Sorting is by whichever column you care about, and the row is a link, so one click takes the same range into that property.
A property summary that answers the obvious next question
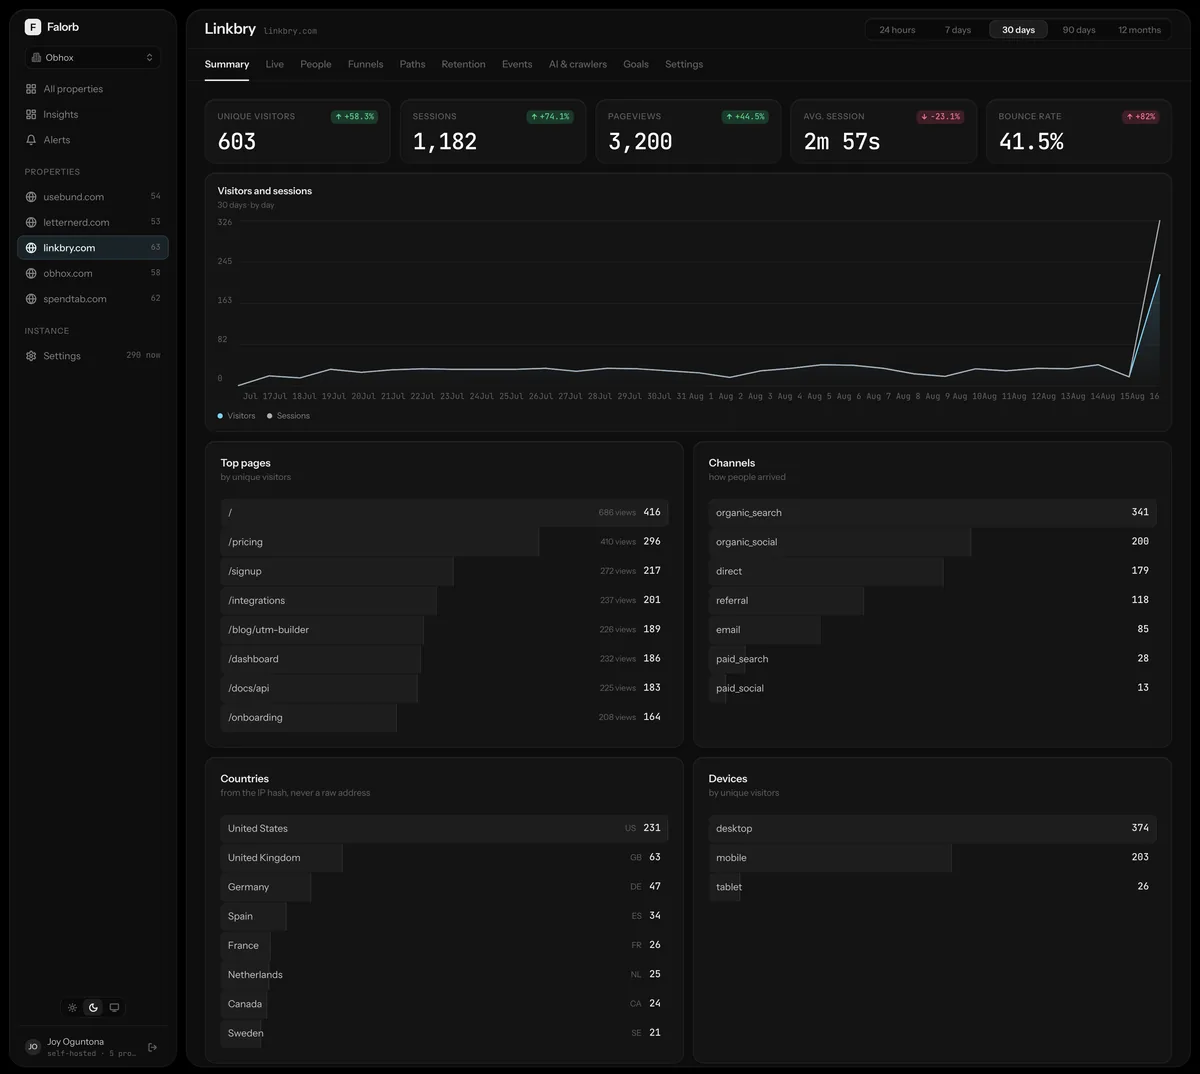
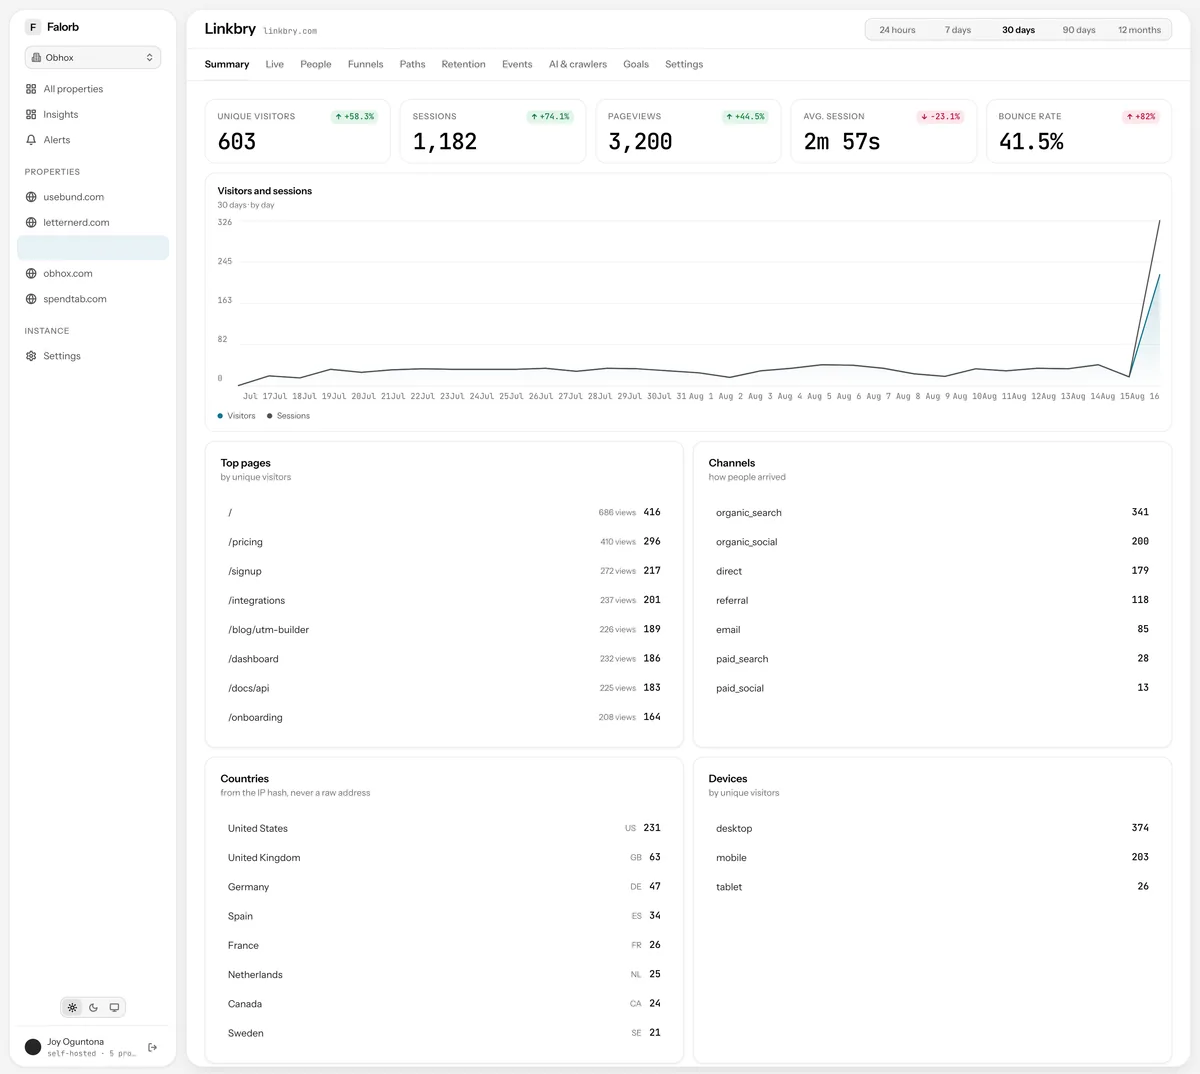
Inside a property: totals, a visitors-and-sessions trend at an interval chosen to fit the range, and four breakdowns (top pages, channels, countries, devices), so the answer to "what changed" is usually on the same screen as the fact that something did.
Breakdowns on any dimension, including your own properties
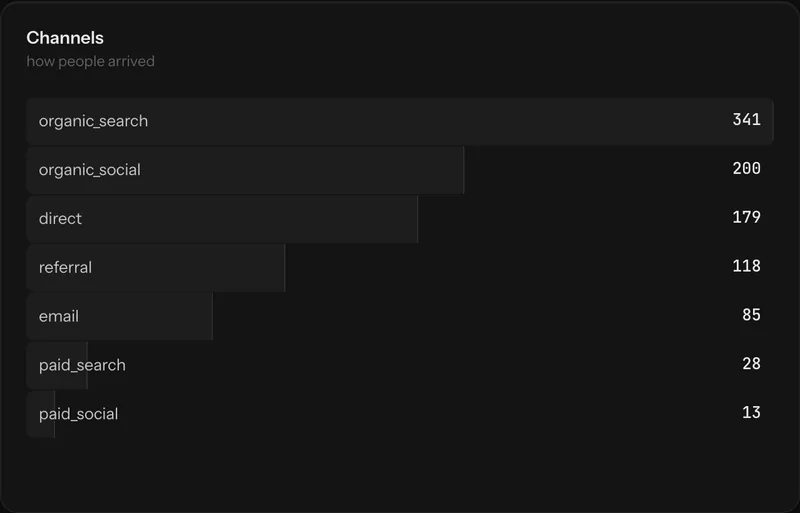
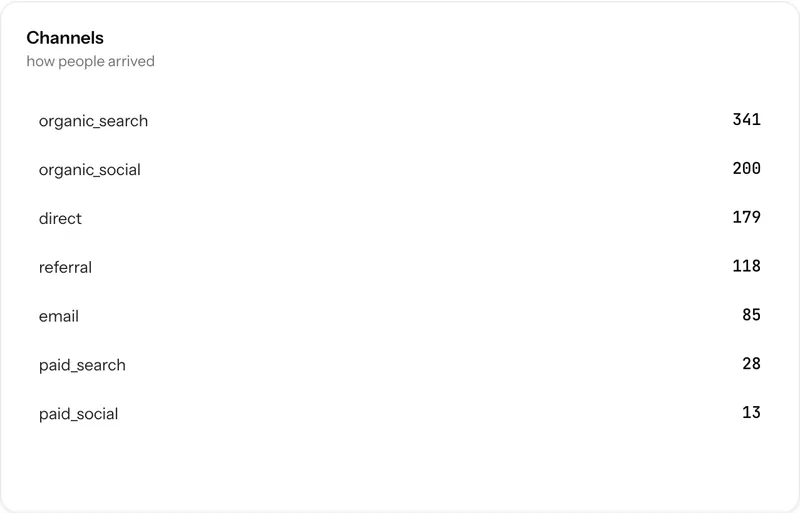
Channels are classified from referrer and UTM parameters across twelve categories, with multi-part public suffixes handled properly so co.uk is not read as a domain. Countries come from in-process GeoIP, devices from user-agent parsing, and any custom property you send with an event is a dimension you can break down by.
- Top pages by pageviews, visitors or exit rate
- Twelve acquisition channels, from direct through paid social
- Country, region, device, browser and operating system
- Any custom property sent with `track()`
More than one workspace, when the portfolio is not all yours
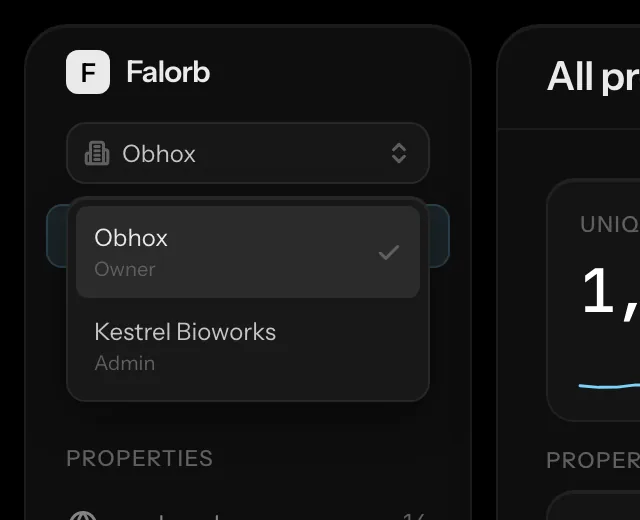
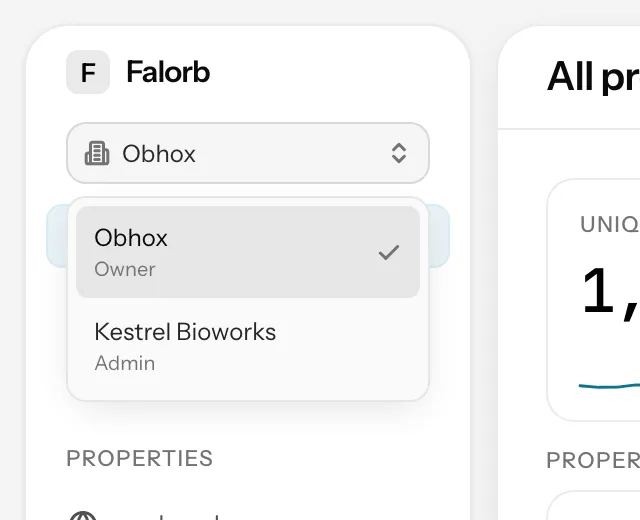
Properties belong to an organization, and a person can belong to several. Agencies and consultancies get a real separation: a client's properties, members and alerts sit in their own workspace, and switching is a control in the sidebar rather than a second login.
How it works, precisely
- Ranges
- 24 hours, 7 days, 30 days, 90 days, 12 months, or an explicit date range
- Comparison
- The immediately preceding window of the same length
- Metrics
- Unique visitors, sessions, pageviews, events, bounce rate, average session duration
- Storage
- ClickHouse, with per-dimension daily rollups rather than one wide table
Portfolio overview: the usual questions
How many properties can one deployment hold?
There is no product limit. Properties are rows, and the query layer filters by project on indexed columns. The practical ceiling is the machine you run ClickHouse on. The reference deployment tracks a portfolio of eight sites on a single small server.
Do the portfolio totals double-count someone who visits two of my sites?
No. Unique visitors are counted over resolved person identities, so somebody who signed in on two of your properties with the same identify() id counts once in the portfolio total and once in each property's own figure.
Next, most people read
Run it yourself this afternoon
Clone the repository, bring up the stack with Docker Compose, paste one script tag. The data never leaves your machines.