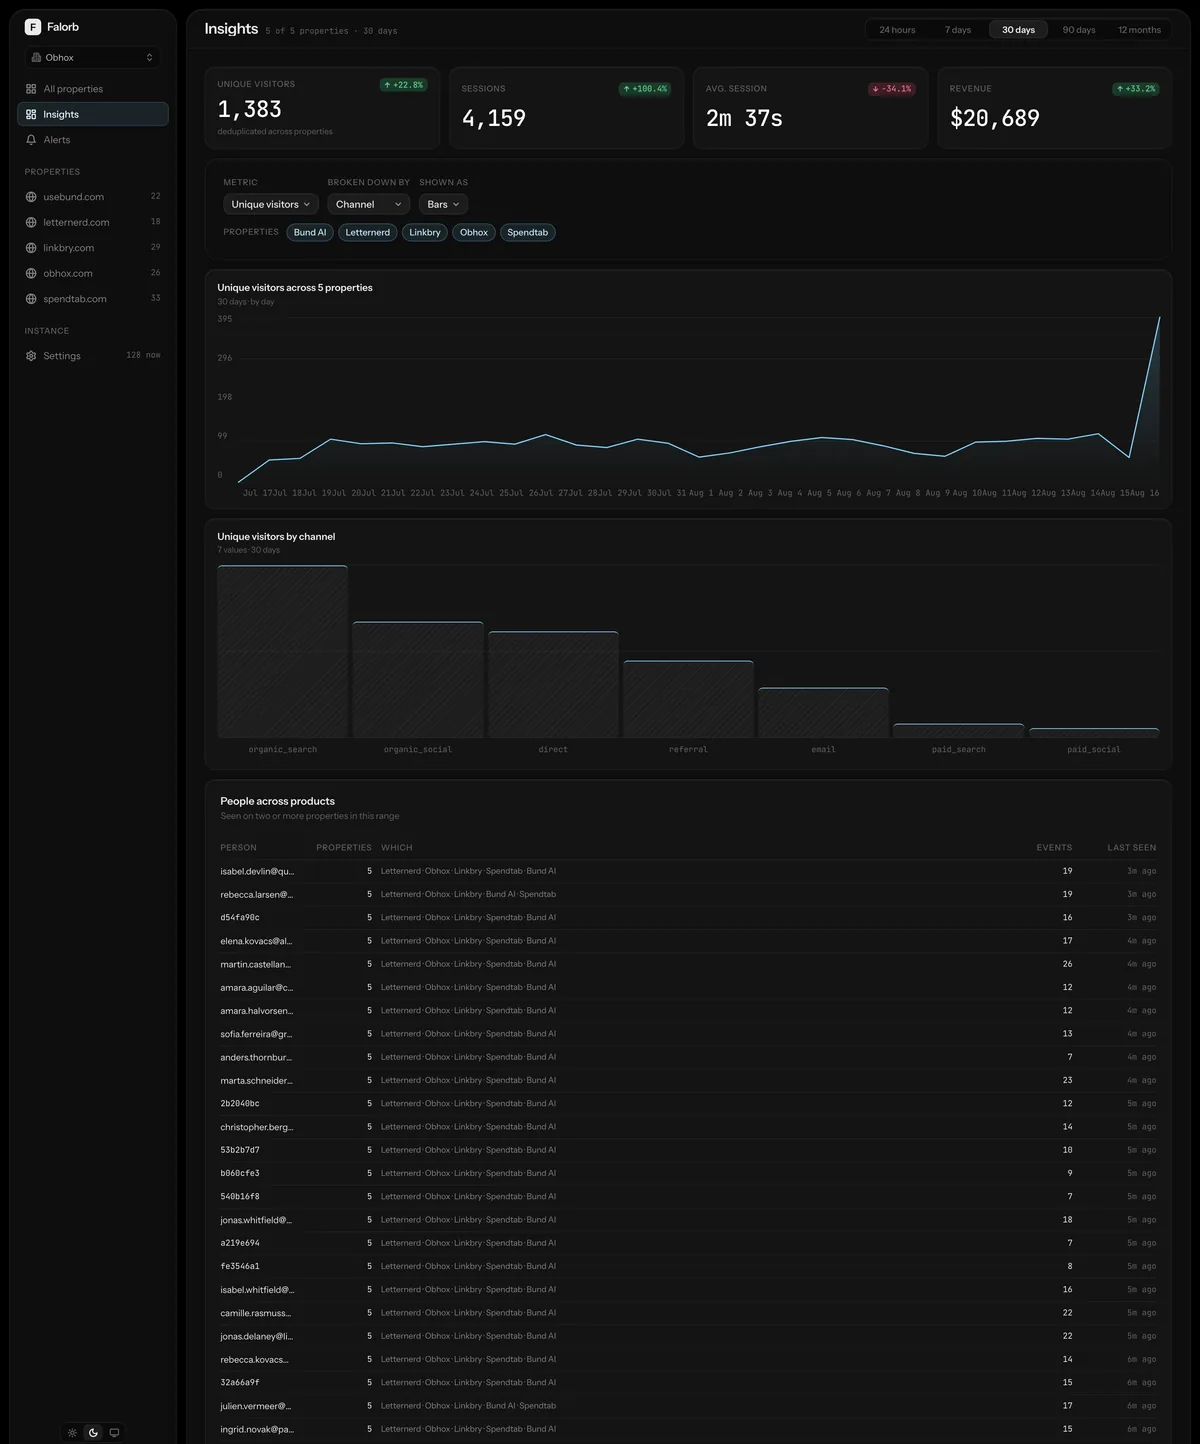
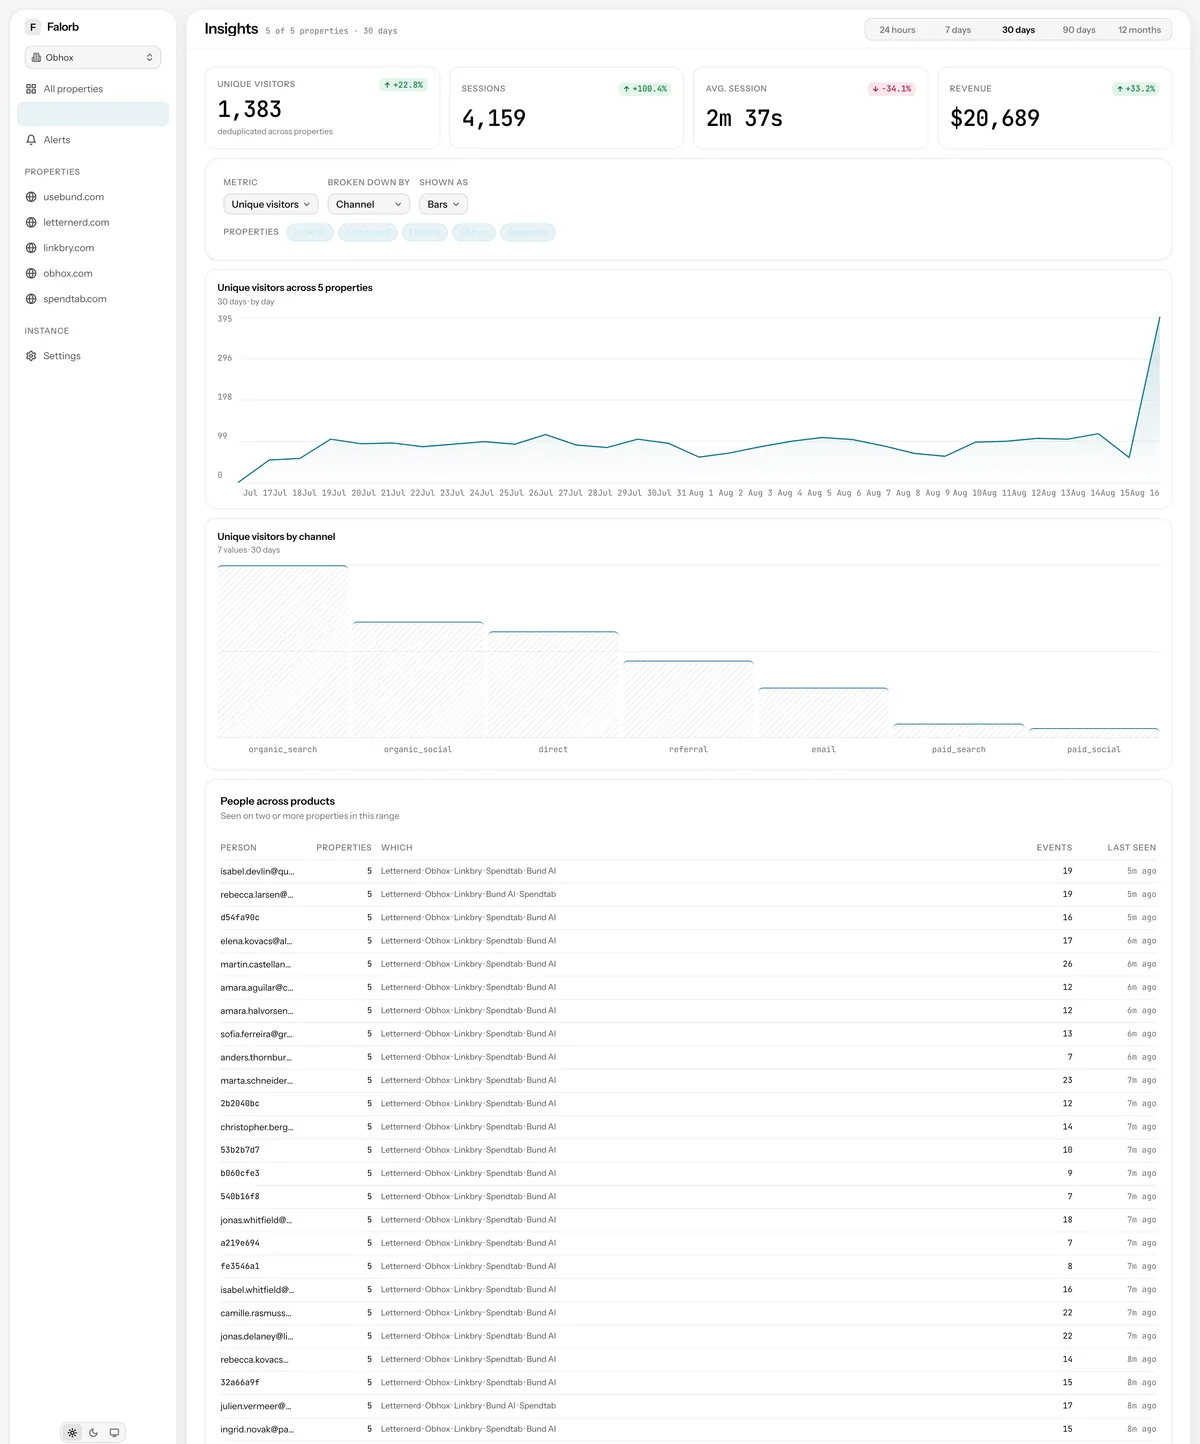
Pick a metric, a dimension and a shape
Visitors, sessions, pageviews, events, bounce rate or session duration, broken down by any allowed dimension, drawn as the chart that suits it. The whole query lives in the URL, so an insight is shared by sending the address.
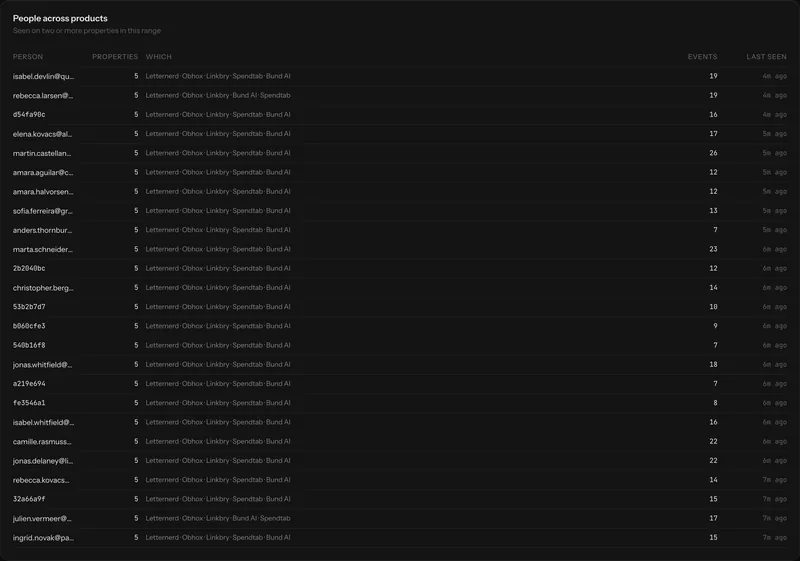
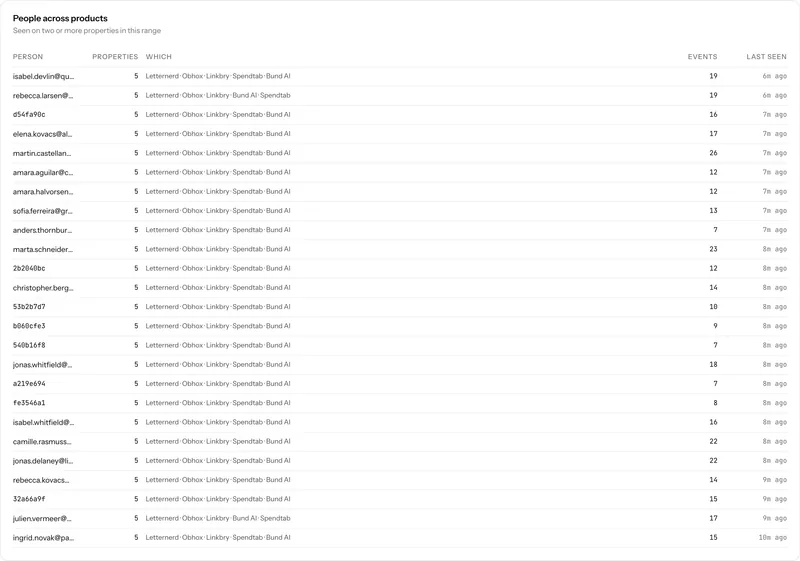
People across products
Everybody seen on two or more of your properties in the range, with which ones, their event volume and when they were last active. On a portfolio this is the single most useful list there is: your existing audience, and it is the cheapest launch channel you have.
Built on the identity graph, not on guesswork
The cross-product join is only as good as the identity resolution underneath it, which is why that resolution is deterministic. Two anonymous visitors are never assumed to be the same person because they look similar; they are the same person because the same identify() id appeared on both properties, or because one of your own decorated links carried them from one domain to the other.
Cross-project insights: the usual questions
How is this different from the portfolio overview?
The overview compares properties as units: visitors, sessions and trend per site. Insights compares the data inside them on a dimension you choose, and resolves the same people across them.
Next, most people read
Run it yourself this afternoon
Clone the repository, bring up the stack with Docker Compose, paste one script tag. The data never leaves your machines.